Oral arithmetic is an important skill for learning more advanced mathematical topics and communicating factual information to others. However, for years I had difficulty finding good ways to practice it in my ESL classes that wasn’t boring or slow. That’s why I developed Mathy Card Game. It’s fun, easy to learn, and takes no time to set up. Players compete to quickly think of a way to calculate a target number using a set of other numbers and common mathematical operations. It’s free for personal use by individual teachers.
How to play
Mathy Card Game can be played by one or many players. In my classes I am the dealer and my students (usually 8 to 12 of them) play with occasional assistance and encouragement from me.
Mathy Card Game uses three kinds of cards: operator cards, target cards, and play cards. Operator cards contain common mathematical operators (+ - × ÷ =). Target cards contain one of the digits 0 to 9 on each side. Play cards contain one of the digits 1 to 9 on one side. The target cards and play cards are separate decks and should be shuffled before each game.
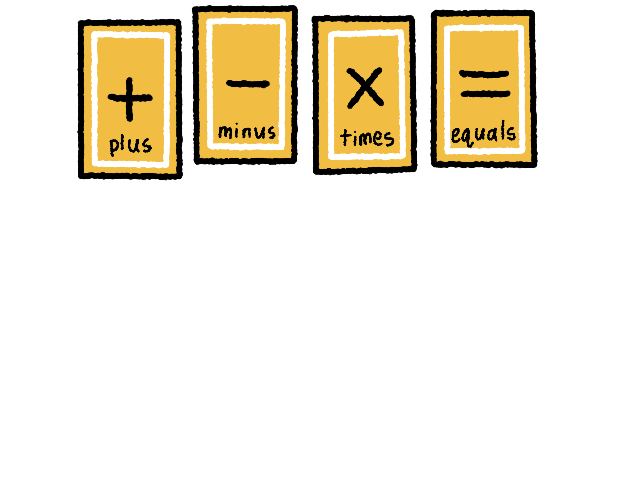
⤷ The dealer lays out all of the operator cards than can be used during the current game. In this picture not all of the operator cards are present, which is better for younger players.
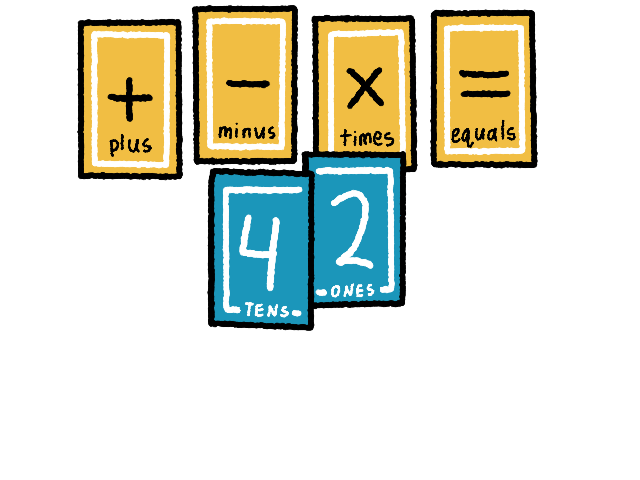
⤷ The dealer lays down two target cards, one with the tens side face up and the other with the ones side face up, and makes a two digit number. This is the target number that the players must calculate.
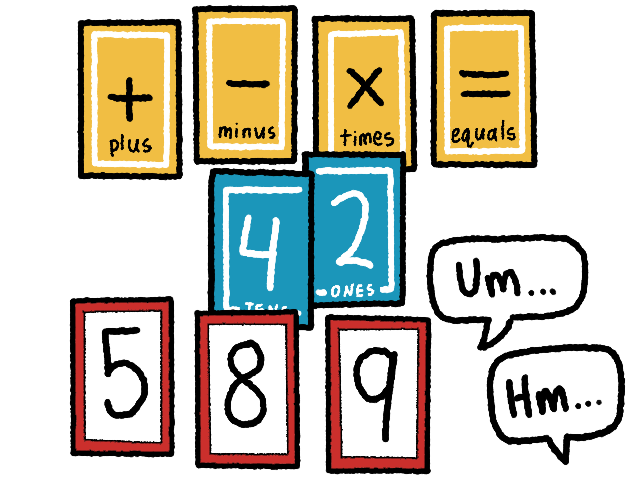
⤷ The dealer lays down a few play cards and the players begin trying to think of way to calculate the target number using the play cards and the operators.
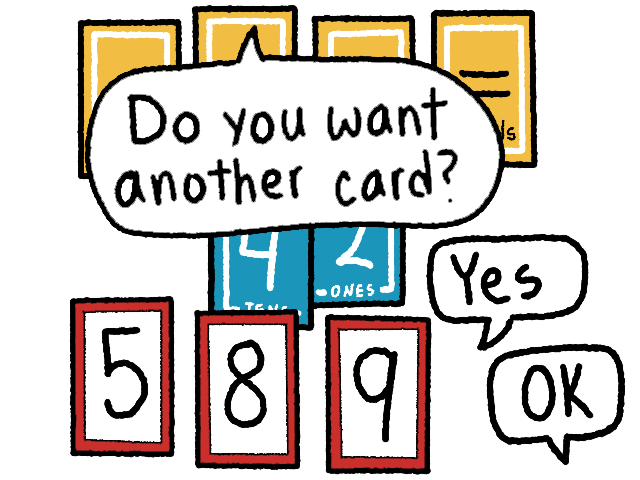
⤷ After letting the players think for a moment, the dealer asks the players if they would like another card. Players can insist on more time to think. In this image the players agree that they want another card.
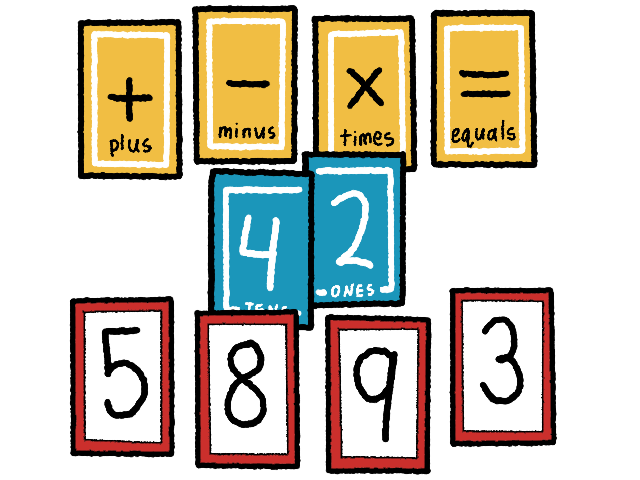
⤷ The dealer, with some dramatic flare, places another play card on the table.
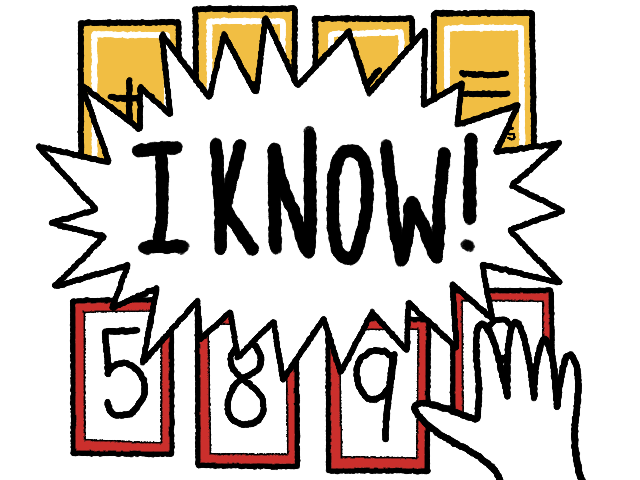
⤷ One player thinks that they have a solution and signals to the dealer.
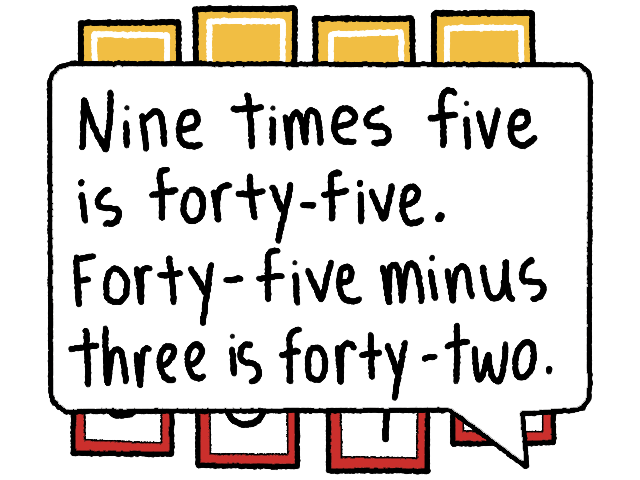
⤷ In very simple terms the player explains how to calculate the target number using any of the play cards and operators. Not all of the play cards need to be used. There are no restrictions on how often a player may use operators or use figurative parentheses. A number card, however, can only be used once in a calculation. For example, if a player wanted to use there must be two 2s on the table.
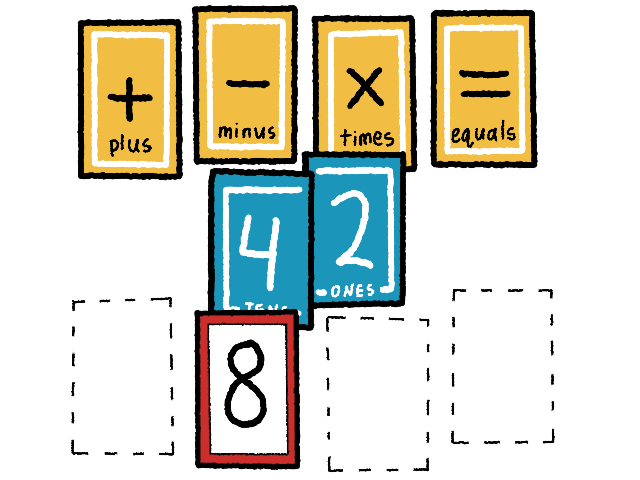
⤷ The player gets to keep the cards they used in their calculation. Every card is worth one point. The dealer returns the target cards and unused play cards to the bottoms of their respective decks. The dealer then starts another round. The game continues until it’s impossible to calculate the target number with all of the remaining play cards. The player with the most points is the winner.
Make your own set
You can easily make your own copy of the game with just 81 blank cards and something to write with. Of the 81 cards there are 6 operator cards, 40 target cards, and 45 play cards.
Operator cards
Each of the six operator cards has one arithmetic operator depicted in the middle. The cards that are laid on the table at the beginning of the game define what operations are allowed to be performed on the play to read the target number. My personal cards that I use with my students also include notes about how to use them in a spoken expression, often in two different ways.
| operator | notes | alt notes |
|---|---|---|
| … plus … | … and … | |
| … minus … | … subtract … | |
| … times … | … multiplied by … | |
| … divided by … | ||
| to the power of | ||
| … is … | … equals … |
Yes, I know that is not an operator, but rather a relational symbol of equality. I keep it with the operator cards for the sake of simplicity and so that my students can be reminded how to speak it.
Play cards
There are 45 play cards. Each one has a digit from 1 to 9 on one side. The other side is blank. The digits are uniformly distributed among the cards, so five 1s, five 2s, etc. Make more if you want your games to last longer.
Target cards
There are 40 target cards. Each side of a target card has a digit from 0 to 9 on both sides. One side is the tens side and the other is the ones side. The digits on the ones side are uniformly distributed, so four 3s, four 4s, etc. The tens side, however, follows are very particular distribution that makes targets in the 20s the most common, with other targets becoming less and less likely in proportion to their distance from the 20s.
| digit | number of cards |
|---|---|
| 0 | 5 |
| 1 | 6 |
| 2 | 7 |
| 3 | 6 |
| 4 | 5 |
| 5 | 4 |
| 6 | 3 |
| 7 | 2 |
| 8 | 1 |
| 9 | 1 |
The tens and ones distributions are independent, so whatever digit is on the tens side of a target card has no bearing on what’s on the ones side. That said, after you finished making all of the ones sides I recommend shuffling the cards before making the tens sides, or vice versa. This will make guessing what’s on the other side of a card more difficult.
My personal set
The set that I use to play with my students is made from a simple pack of blank cards that cost less the $1 USD. Here are what the various cards look like:
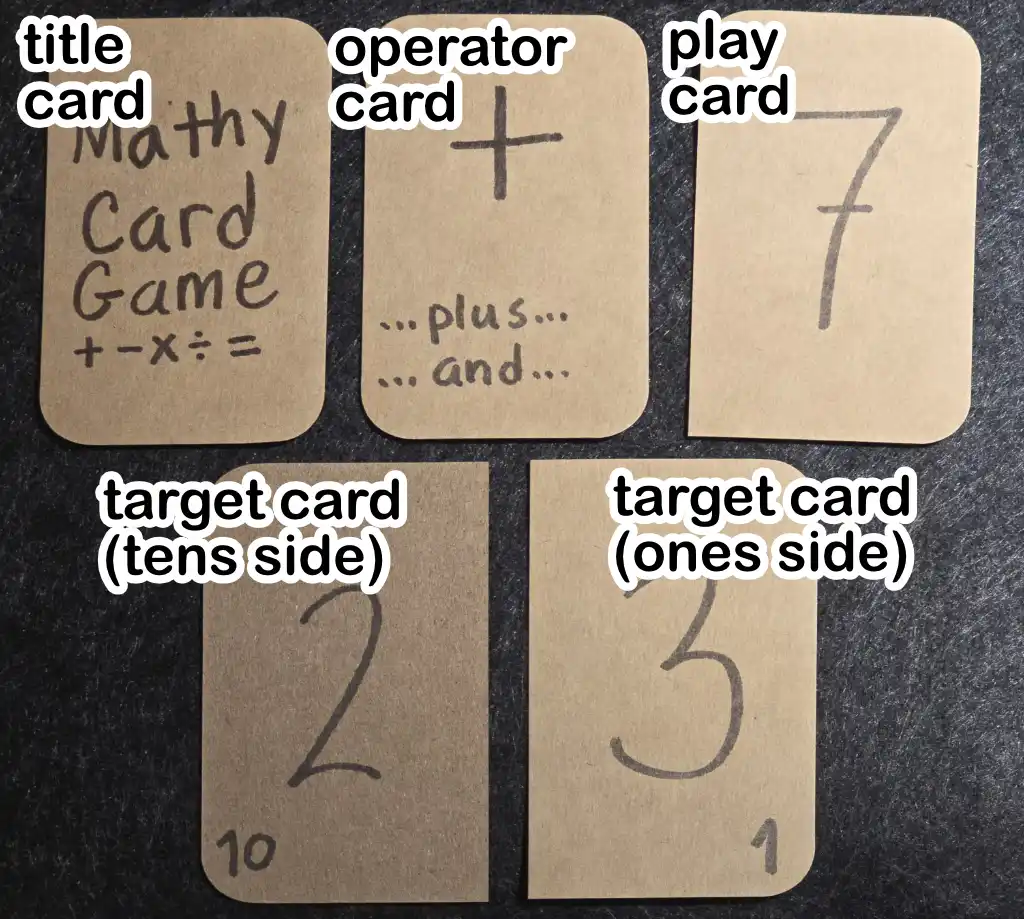
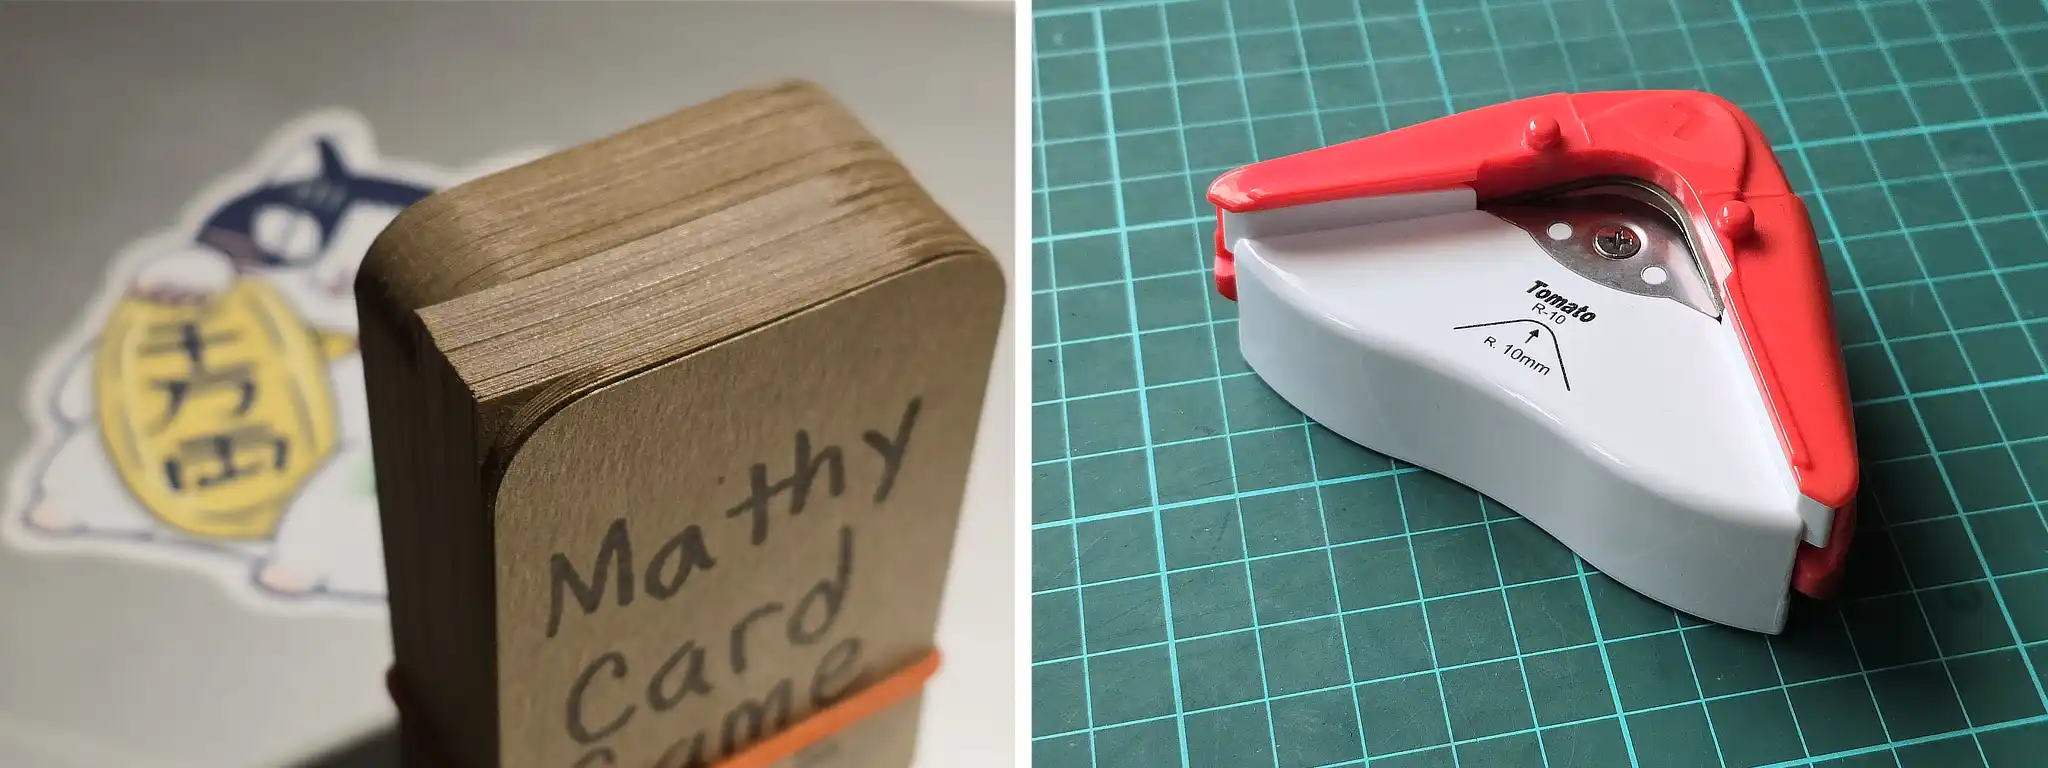
I found that cutting the corners differently for each type of card helps tremendously for keeping them organized and separating the different sub-decks when it’s time to play. The target cards are cut such that they form a nice rounded rectangle when placed next to each other. The play cards are cut such that the shape enforces only one obvious way to stack them, so I can trust my students to keep them orderly as they collect them during the game. The operator and title cards are cut differently just to differentiate them when all of the cards are together.
Variations
- Not all operator cards need to be used in a game. For my younger students I do not use exponents or division.
- The dealer can also participate as a player.
- It’s still fun to play on your own!
- Points can be shared among teams of players instead of just individuals.
- If the game takes too long, you could play until a player reaches a certain number of points or use fewer play cards.
- If your players have good arithmetic skills you can forego making target cards and use the play cards for targets. Doing it this way means that higher target numbers will be more common and single digit targets numbers will be impossible because there are no zeroes to go in the tens place. It also means that 10, 20, etc. will also never be targets.
- If your players are truly exceptional, you could concoct rules for three digit targets, fractional targets, etc.
Considerations
- My students sometimes groan when I pull this game out, but I think that’s because they’ve learned to dislike math in any context. After a few minutes of play they’re usually fully committed to the game and having a great time.
- A small number students hate this game. Maybe they have always struggled with math or have had bad experiences with math education. Try to be empathetic and don’t pressure them. Hopefully they’ll come around when they’re ready.
- After a player signals that they have an answer, you may want to impose a time limit on how long they have to speak it completely. In my classes I typically disqualify a student if they remain silent for several seconds.
- Clever players may realize they can get more points by doing things like using in their calculations. I always let them do that and even encourage it.
- If you are a teacher and the dealer, don’t feel like you have to remain silent. I often tell my students when I see an answer, but not what it is exactly.
- When you are not using the target cards deck you can keep the ones side face up on the table. When you draw a new target number use the tens side of the top card, which nobody will have been able to see. This maintains a sense of mystery of what the next target will be.
Designing the game
⚠️ By this point you have everything you need to play the game and make your own copy. Everything from here on onward is technical background information about how I developed the game.
Target cards distribution
Because in my ESL classes I mostly teach elementary school aged children, I wanted to keep target numbers rather low, like in the 20s or 30s, but still with a small chance for targets like 00, 99, and everything in between. I thought that it would be nice if the distribution of target numbers across many games could resemble a normal distribution. Of course since there are bounds at 0 and 99, it would have to be a truncated normal1, which has a pretty gnarly PDF:
for , with otherwise.
Here is the PDF of the standard normal distribution and is it’s CDF.
I messed around with a plot I found on Desmos, added a few parameters of my own thought that this looked pretty good.
Now my plan was to integrate over portions of the PDF to get the distribution of target cards. For example the frequency of 24 should be
But there’s already a problem. Given the above distribution, the frequency of 99 should be about 0.0017 which is one-ninth the frequency of 24. In other words, to achieve the distribution using real cards, if there were just one 99 target card, there would have to be nine 24s! Along with all of the other target cards there would have to be at least… I’m not sure, but clearly way too many. I had to think of a way to get a good enough approximation of the distribution with a manageable amount of cards.
The solution I arrived at after a lot of tinkering was to split the target numbers into two parts, the tens and the ones, and create independent distributions for each. It’s like answering the question, “Given the original distribution, what’s the probability of drawing a card with a 3 in the tens position?”
I used the Python package SciPy2 to write a little script that crunched to numbers for me. There’s a link to a Google Colab notebook in the footnotes if you want to play around with it3. The TENS_DECK_SIZE and ONES_DECK_SIZE constants exists because I originally wanted them to be separate decks.
from scipy.stats import truncnormfrom scipy.integrate import quad

LOC = 24             # The center of the non-truncated distribution.SCALE = 36           # The standard deviation of the non-truncated distribution.LOWER = 0            # The lower bound.UPPER = 100          # The upper bound.TENS_DECK_SIZE = 40  # How many cards are in the tens deck.ONES_DECK_SIZE = 40  # How many cards are in the ones deck.AUTO_ADJUST = True   # Ensure deck has an even number of cards.

# Generate probabilities of each target number# by integrating over a truncated normal distribution.# See scipy.stats.truncnorm documentation for more info.a = (LOWER - LOC) / SCALEb = (UPPER - LOC) / SCALEpdf = truncnorm(a, b, loc=LOC, scale=SCALE).pdftarget_probs = [quad(pdf, i, i+1)[0] for i in range(0, 100)]

# Make two arrays that hold the accumulated frequencies of every# tens and ones digit from the ideal targets distribution.tens = [0] * 10ones = [0] * 10for target, prob in enumerate(target_probs):    tens_digit = target // 10 % 10    ones_digit = target % 10    tens[tens_digit] += prob    ones[ones_digit] += probtens_deck = list(map(lambda x: round(x * TENS_DECK_SIZE), tens))ones_deck = list(map(lambda x: round(x * ONES_DECK_SIZE), ones))

# The tens deck might be off by one. This corrects the error.# Add to the first moment if there's a deficit and remove a 9 if# there's a surplus.error = sum(tens_deck) - TENS_DECK_SIZEif (error != 0 and AUTO_ADJUST):    print(f'Error: {error}. Adjusting')    if error < 0:        max_count = max(tens_deck)        max_cards = [i for i, j in enumerate(tens_deck) if j == max_count]        mean_card = round(sum(max_cards) / len(max_cards))        tens_deck[mean_card] -= error        print(f'Added {-1 * error} more {mean_card}(s).')    else:        tens_deck[9] -= error        if tens_deck[9] < 0:            raise ValueError('There is a negative amount of 9s!')
print('Tens:')print({str(i): j for i, j in enumerate(tens_deck)})print('Ones:')print({str(i): j for i, j in enumerate(ones_deck)})
Which outputs this.
Tens:{'0': 5, '1': 6, '2': 7, '3': 6, '4': 5, '5': 4, '6': 3, '7': 2, '8': 1, '9': 1}Ones:{'0': 4, '1': 4, '2': 4, '3': 4, '4': 4, '5': 4, '6': 4, '7': 4, '8': 4, '9': 4}At this deck size only the tens digits follow something like the ideal distribution from the beginning, while the ones digits appear uniformly distributed. This is going to produce something like a stepwise distribution over the course of many samples. Let’s take a look.
import randomimport matplotlib.pyplot as plt

DRAWS = 1_000_000possible_targets = [f'{i:02}' for i in range(LOWER, UPPER)]drawn_targets = {t: 0 for t in possible_targets}rand_tens = random.choices(range(len(tens_deck)), weights=tens_deck, k=DRAWS)rand_ones = random.choices(range(len(ones_deck)), weights=ones_deck, k=DRAWS)for i in range(DRAWS):    target = str(rand_tens[i]) + str(rand_ones[i])    drawn_targets[target] += 1

labels = drawn_targets.keys()values = [i / sum(drawn_targets.values()) for i in drawn_targets.values()]

fig, ax = plt.subplots(figsize=(16, 4))bar_plot = ax.bar(labels, values)plt.xlim(-0.5, len(drawn_targets.keys())-0.5)for i, label in enumerate(ax.get_xticklabels()):    if i % 10 != 0:        label.set_visible(False)plt.show()
Looks good to me 🥳
